
One of the chief aims of the Rail series was to provide a stable and manageable ride. This was a major consideration in the 52 being the 52, and not the 58 or the 60 or the 62. The 34 was in large part born from the market demand for a wheel that would be nigh on invisible to crosswinds, even though early 52 reviews were near unanimously positive in regard to manageability.
The cross sectional design of Rails attempts to create a near symmetry between rim side and tire side. Obviously, tire choice affects this. We had a 23 in mind, aware of the size to which most 23s would inflate on our chosen 18mm bead seat width. Different tires have different shapes, and many people use different sizes. Nonetheless, the general gist stands.
To date, crosswind stability has been measured subjectively and anecdotally, never directly measured and quantified. Thankfully, a wheel company from Indiana had been pestering A2 for an actual measured match to their CFD predictions. Recently, A2 completed the measurement apparatus and algorithms to provide these measures. When you test a wheel now, your data sets include two new columns - coefficient of drag, and center of pressure.
Ceofficient of drag, simply stated, is how much pressure is pushing against your wheel - how strong is the push. Units of measure are non-specific, but linear - meaning that .20 is twice as hard a push as .10, and 2/3 as big a push as .30. Center of pressure describes the position of the push, relative to the hub, measured in centimeters. Center of pressure of 2.35 would describe a push centered 2.35cm in front of the hub. -3 would describe a push 3cm behind the hub.
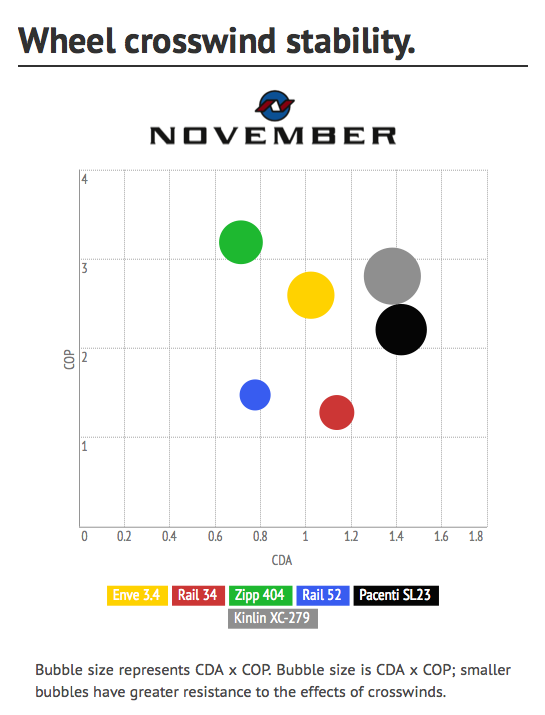
To date, we've never seen any graphical presentation of this data. It's too new a concept, so we've taken a stab at it, which we think provides a clear picture of the relative power and placement of the crosswind's push on each wheel. We have once again used the Tour Magazine angle of attack weighting in creating this chart, but we have used the 25mph weighting. Our reasoning for this is that as wind speeds increase relative to bike speed, the likelihood of wider angles of attack increases. We expect and welcome questions about this information and presentation, simply because we want it to be easily understood.
Here is a link to a page that allows you to calculate apparent wind speeds and angles for any given combination (be sure and use the second box, the first one calculates to true wind speed). Be aware as you do this that a windy city will have an average windspeed of somewhere around 10mph (the calculator uses knots - 10mph equals 8.7 knots), as measured at that city's airport. Airport windspeed is measured high off the ground in an unobstructed place, and will overstate what your wheels are riding in by quite a bit - like 50% or more.

To say the results pleased us would be an understatement. As the initial test of the 34 was underway, I was busily prepping the next wheel to test in the work room and poked my head into the control room to ask if I was in a good mood. Dave, A2's engineer and a man not given to subjective statements or value judgments, said the aero drag measurements were going right along, but that the pressure measurements should put me in a very good mood indeed. As the 52 ran and the data came up, my mood improved even more.
As you can imagine, we're excited to see that our consideration of crosswind stability in the design of the Rail has been confirmed with such excellent results.
16 comments
nice work Dave! This is better work than most PhD thesis! Good job.